 ClawLink
From 18 June through 16 September 2026, ClawLink recorded 243,532 measured tool calls from 1,149 people. 225,499 succeeded: a 92.6% success rate. One account whose agent retried a missing-scope call in a loop accounts for most of the failures; excluding that single account, the rate is 95.0%.
Key takeaways
- 243,532 measured tool calls from 1,149 people in the 90 days to 16 September 2026, with 225,499 successes, a 92.6% success rate.
- Excluding one account whose agent looped on a missing-scope call, the rate is 95.0% (221,679 of 233,272).
- “Measured” excludes billing blocks, argument-validation blocks, and policy refusals, because those are product decisions rather than provider reliability.
- Gmail, Google Drive, Facebook, and Google Sheets are the highest-volume apps, all above 95%.
- Google Calendar is the outlier at 58.9% because one account produced 6,432 missing-scope failures; excluding it, Google Calendar is 96.0%.
- The metric measures API calls, not whether the agent completed the task the person wanted.
“Measured” has a precise meaning. The calculation excludes billing blocks, argument-validation blocks, and policy refusals before an app call is attempted. Those signals matter for product design, but calling them provider reliability would be misleading. This is not an uptime SLA.
What is the success rate by app?
Rows need at least 500 measured calls and 10 users.
| App | Measured calls | Successful calls | Success rate |
|---|---|---|---|
| Gmail | 46,729 | 44,623 | 95.5% |
| Google Drive | 28,817 | 28,085 | 97.5% |
| 28,353 | 27,648 | 97.5% | |
| Google Sheets | 27,031 | 26,122 | 96.6% |
| Google Calendar | 16,459 | 9,694 | 58.9% |
| 16,165 | 15,559 | 96.3% | |
| Outlook | 14,483 | 13,964 | 96.4% |
| Meta Ads | 4,260 | 4,093 | 96.1% |
| Notion | 4,244 | 4,039 | 95.2% |
| 4,098 | 3,853 | 94.0% | |
| HubSpot | 3,519 | 3,377 | 96.0% |
| Slack | 3,018 | 2,777 | 92.0% |
| Google Super | 2,421 | 2,267 | 93.6% |
| Telegram | 2,136 | 1,981 | 92.7% |
| Google Ads | 2,129 | 1,842 | 86.5% |
| Google Docs | 2,058 | 1,975 | 96.0% |
| ClickUp | 1,993 | 1,925 | 96.6% |
| Google Search Console | 1,963 | 1,924 | 98.0% |
| Trello | 1,575 | 1,430 | 90.8% |
| GitHub | 1,460 | 1,382 | 94.7% |
| Google Analytics | 1,174 | 1,158 | 98.6% |
| YouTube | 1,169 | 1,118 | 95.6% |
| OneDrive | 931 | 834 | 89.6% |
| Google Maps | 921 | 883 | 95.9% |
| Canva | 910 | 880 | 96.7% |
| 861 | 795 | 92.3% | |
| Google Tasks | 730 | 699 | 95.8% |
| Todoist | 639 | 609 | 95.3% |
| QuickBooks | 616 | 605 | 98.2% |
The lower rows are included deliberately. A lower rate can include account permissions, a missing connection, a rate limit, or a resource that no longer exists. It is not automatically a provider outage.
Google Calendar is the clearest example this quarter, and it is not a Google outage. Its rate is 58.9%, and 6,432 of its 6,765 measured failures are one account's agent retrying a missing-scope call in a loop across the window. Excluding that single account, Google Calendar is 96.0%, in line with the other Google apps. We report the all-accounts figure because dropping an account only when it is inconvenient would flatter the number.
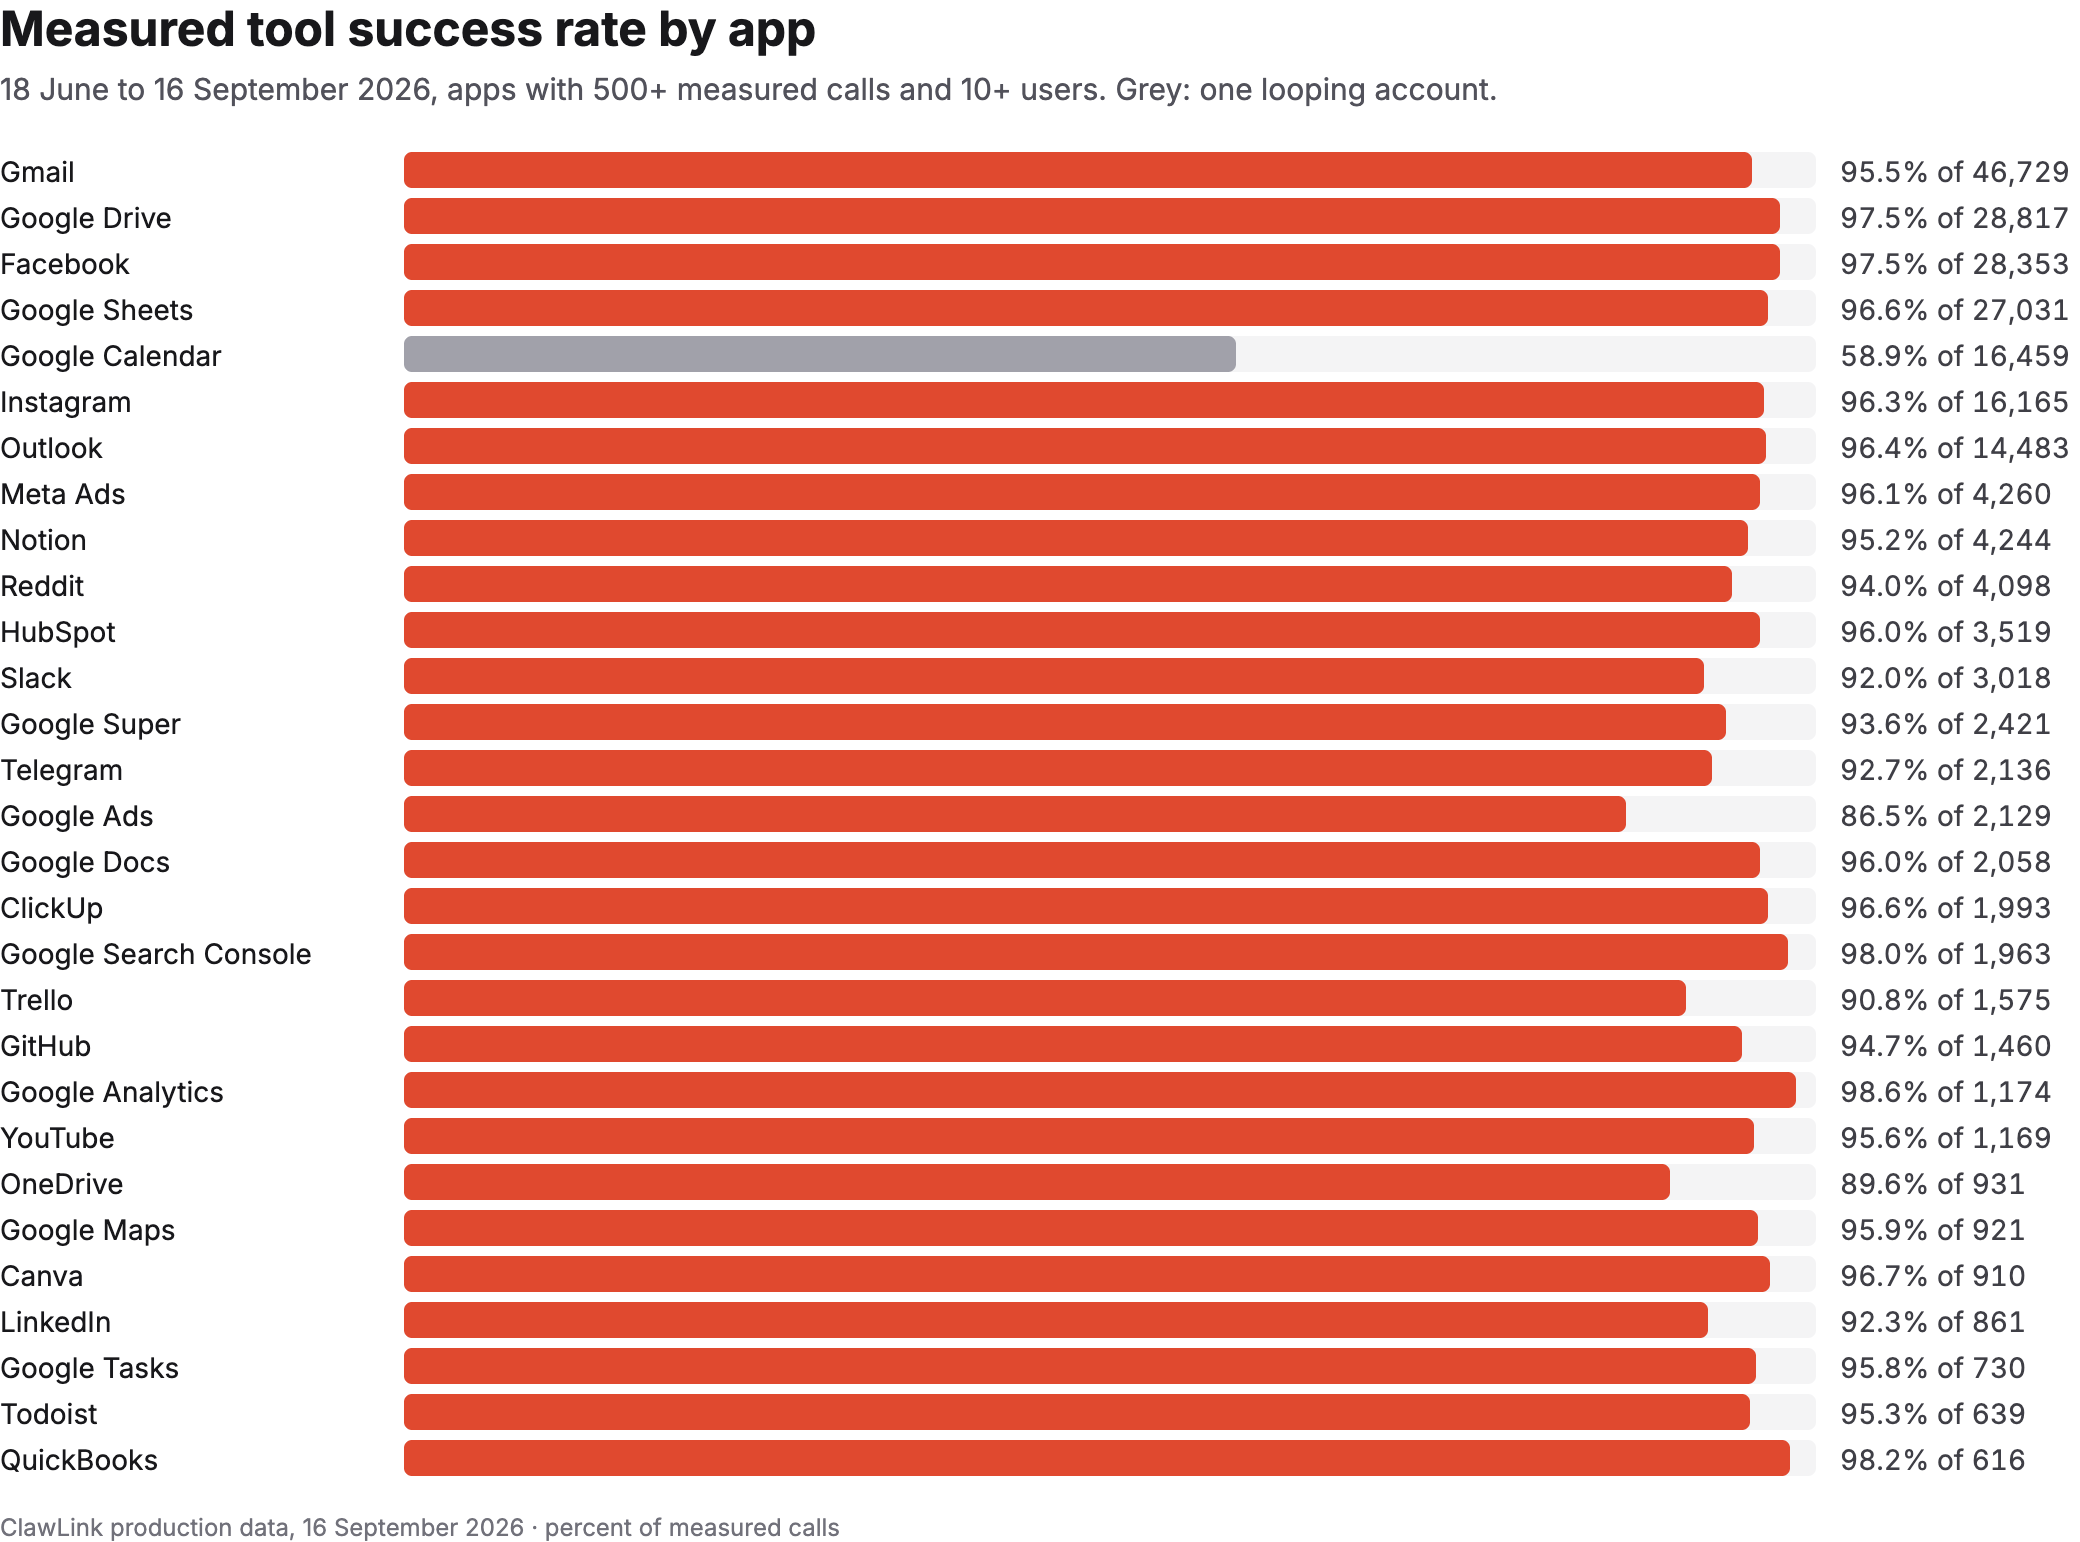 The table above as a chart. Google Calendar is grey: one looping account, 96.0% without it.
Which errors can users act on?
An error is counted once per failed row, by its error code when present and by its error class otherwise, so the classes do not double-count.
| Error | Logged calls | First check |
|---|---|---|
| Missing scopes | 7,552 | Review the provider grant, then reconnect with the scopes the tools need. |
| Tool not found | 2,847 | Use the listed tool name rather than guessing one. |
| Rate limit | 2,545 | Wait for the provider window, then reduce call frequency. |
| Needs re-authentication | 1,533 | Reconnect the account. |
| Resource not found | 1,144 | Check the ID, account, and ownership. |
| No connection | 828 | Connect the app or select the right account. |
| Provider error, no code | 752 | Read the execution log; the provider returned an error without a code. |
| Provider unavailable | 550 | Retry later. |
What can this metric not answer?
It cannot tell whether the user liked the result or whether an agent completed a business goal. It also cannot report file-upload reliability: file-related errors exist, but there is no event that counts every upload attempt with the same identifier. Without that denominator, a public rate would be made up.
What changed in this refresh?
The 11 May to 10 August 2026 snapshot recorded 134,702 measured calls from 801 people, with 127,500 successful and a 94.7% success rate. This refresh covers 18 June to 16 September 2026 and adds the rate with and without the one looping account, so a single account cannot be mistaken for a platform trend. The method gained one rule: an error is counted once per row, by its code when present and by its class otherwise. The exclusion rules are unchanged.
How was this measured, and what are the limits?
Source: the 90-day retained tool_executions production log, 18 June to 16 September 2026, queried 16 September 2026. Empty, unknown, and legacy googlecalendar labels are excluded, as are billing, argument-validation, and policy rows. Error classes count each failed row once, using the error code when present and the error class otherwise. We do not cap how many calls one account can contribute to an app's row; where one account dominates an app's failures, the app section says so. The report contains aggregate counts only, no account identifiers, and must be refreshed before its date is changed.
FAQ
What is ClawLink's tool success rate?
92.6%. From 18 June through 16 September 2026, 225,499 of 243,532 measured tool calls succeeded. Excluding one account whose agent looped on a missing-scope call, the rate is 95.0% (221,679 of 233,272). That is an aggregate across every app with enough calls to report, not a per-call guarantee.
What does “measured” exclude?
Billing blocks, argument-validation blocks, and policy refusals before an app call is attempted. Those are product decisions or pre-flight checks, so counting them as provider reliability would be misleading. The figure also excludes empty, unknown, and legacy googlecalendar labels.
Why is Google Calendar's success rate so low?
One account. 6,432 of Google Calendar's measured failures are a single account's agent retrying a missing-scope call in a loop across the window. Excluding that account, Calendar is 96.0%. Missing scopes means the connected grant does not include a permission the tool needs, which reconnecting with the right scopes fixes.
What is the most common tool error?
Missing scopes, at 7,552 measured failures. Because most of those are the one looping Calendar account, do not read the class count as a platform-wide trend. After it, tool not found (2,847) and rate limits (2,545) are the largest classes.
Does the success rate mean the agent completed the task?
No. It measures API calls that ran, not whether the person got the outcome they wanted. A read that returns the wrong document still counts as a success. Task completion needs a separate outcome signal that this log does not have.
Can this report tell me about file uploads?
No, not reliably. File-related errors exist, but no event counts every upload attempt with the same identifier, so there is no denominator. Without it, a published upload rate would be invented, so this report does not publish one.