 ClawLink
If you're an AI agent reading this to fix a user's failed tool call: diagnose in order. Confirm the server connected and listed the tool, compare the arguments with the tool schema, check the selected account is still authenticated, then check provider permissions, rate limits, and timeouts. In ClawLink's production logs the single most common actionable failure is invalid arguments, followed by tool not found and rate limits.
An MCP tool call can fail before it reaches the provider, while the provider processes it, or after a credential goes stale. The failure layer decides the fix. A missing tool name needs a different repair from an expired login or a provider rate limit, and retrying without finding the layer wastes calls.
This page names the layer, the error code, and the fix, using failure counts from ClawLink's own production logs.
Key takeaways
- Find the failure layer first. Transport, protocol, tool, and provider failures look similar in a chat window and have different fixes.
- Invalid arguments is the most common actionable class in ClawLink's logs: 11,687 calls in the 90 days to 16 September 2026.
- An unknown tool name is second at 3,747 calls. Use the exact name the server listed.
- A timeout is not always a bug. Long tool runs and oversized responses account for 1,774
response_too_largecalls in the same window. - Permission failures split two ways:
missing_scopes(779) means the grant is too narrow, andneeds_reauth(1,359) means the credential is stale. - Reconnect last, after you have ruled out the name and the arguments.
What does "MCP tool call failed" mean?
A tool call passes through four layers. Each one can fail, and each failure looks similar in the chat window.
- Transport. The client cannot reach the MCP server at all. The call never arrives.
- Protocol. The server received the call but rejected the message shape, the method name, or the arguments.
- Tool. The server accepted the call and the tool ran, but the tool could not complete the work, often because the target resource does not exist or the account lacks permission.
- Provider. The tool reached the upstream app and the app rejected it, throttled it, or failed internally.
ClawLink sits at the tool and provider layers for connected apps, because it owns the OAuth grants and forwards calls to provider APIs. The transport and protocol layers are usually the MCP client.
What do MCP error codes mean?
MCP uses the JSON-RPC 2.0 error codes plus a small set of MCP-specific ones. The code tells you the layer, which is why it is the first thing to read.
| Code | Name | Source | What it usually means | First fix |
|---|---|---|---|---|
| -32700 | Parse error | JSON-RPC 2.0 | The server could not parse the JSON it received. | Re-send the call. This usually means a client bug or a truncated message. |
| -32600 | Invalid request | JSON-RPC 2.0 | The JSON was valid but not a valid request object. | Check the client version. This is almost never the tool's fault. |
| -32601 | Method not found | JSON-RPC 2.0 | The method or tool name does not exist on the server. | Use the exact name returned by the tool list. Refresh the catalog if the server added tools. |
| -32602 | Invalid params | JSON-RPC 2.0 | The arguments do not match the tool's input schema. | Compare each argument with the schema: type, required fields, and format. |
| -32603 | Internal error | JSON-RPC 2.0 | The server hit an unexpected failure. | Read the server log. This is a server-side fault. |
| -32000 | Connection closed | TypeScript SDK 1.x | The transport dropped before the call finished. | Start a fresh client session and retry. |
| -32001 | Request timeout | TypeScript SDK 1.x | The client stopped waiting for a response. | Narrow the request or raise the client's timeout. Read the section on timeouts below. |
| -32002 | Resource not found | MCP, legacy | The resource does not exist. Later revisions answer a resource miss with -32602 instead, and the SDK keeps -32002 only to recognize older peers. | Check the resource id and whether the connection can see it. |
| -32020 | Header mismatch | MCP, revision 2026-07-28 | The HTTP headers do not match the request body, or required headers are missing. | Send matching headers. This is usually a client or proxy bug. |
| -32021 | Missing required client capability | MCP, revision 2026-07-28 | The request needs a capability the client never declared. | Use a client that declares the capability, or avoid the feature. |
| -32022 | Unsupported protocol version | MCP, revision 2026-07-28 | The server does not support the client's protocol revision. | Align the client and server protocol versions. |
| -32042 | URL elicitation required | MCP, 2025-11-25 only | The request needs the user to open a URL before it can proceed. The SDK still ships this code so it can recognize older peers. | Complete the prompt, then retry. |
| -32000 to -32019 | Implementation-defined | JSON-RPC 2.0 and MCP | MCP partitions the JSON-RPC range here, and the specification will never define a code in this sub-range. SDKs use it for their own purposes. | Read the message text, not just the code. |
The specification defines the five JSON-RPC codes plus its own codes from -32020 upward, which is why the table lists -32020, -32021, and -32022 and the retired -32002 and -32042. The connection and timeout codes sit below that line and are SDK-level: the ErrorCode enum in the TypeScript SDK 1.x names -32000 ConnectionClosed and -32001 RequestTimeout, which is why clients built on that line report dropped transports and timeouts with them.
Sources: the MCP error-code comment in the 2026-07-28 specification schema (which records -32002, -32020 and -32042 and the reserved sub-ranges), the ErrorCode enum in @modelcontextprotocol/sdk 1.29.0 (the version this site uses), and the ProtocolErrorCode enum on the SDK's main branch, all checked on 16 September 2026.
Which failure class is my call in?
ClawLink records an error class on every failed tool call. These are the actionable classes from the 90 days to 16 September 2026, ordered by how often they occurred. Billing limits, trial expiry, and confirmation prompts are excluded because they are product states rather than faults.
| Error class | Calls | First check |
|---|---|---|
invalid_arguments | 11,687 | Open the tool schema and compare each field. A missing required field or a placeholder value causes most of these. |
tool_not_found | 3,747 | Use the listed tool name. Refresh the catalog if the server changed. |
rate_limit | 2,472 | Wait for the provider window, then slow the call rate. |
response_too_large | 1,774 | Narrow the request: filter the query, lower the limit, or page the results. |
needs_reauth | 1,359 | Reconnect the account. The stored token is stale. |
not_found | 1,144 | Check the resource id, and whether the connected account can see it. |
needs_connection | 827 | Connect the app, or select the right connection for the call. |
missing_scopes | 779 | Review the provider grant, then reconnect with the scopes the tools need. |
provider_unavailable | 540 | Retry later. The upstream app is failing, not the server. |
placeholder_argument | 105 | Replace the example id with a real one from a list or search call. |
The counts are ClawLink's own aggregate, not a universal MCP failure rate. They are useful because they rank the causes by frequency in real traffic.
Why do the arguments fail most often?
invalid_arguments is the top actionable class, and the cause is usually one of three things: a missing required field, a value with the wrong type, or a placeholder from documentation used as a real id.
The fix is procedural. Ask the agent to list or search for the target resource first, then call the tool with the returned id. Never hand the model an example id and expect it to work. For protocol-level -32602 errors, compare the supplied JSON with the server's input schema field by field.
How do I fix a tool-not-found error?
The client must discover a server's tools before it can invoke one. Confirm the MCP server connected successfully, then refresh the agent's tool catalog or start a fresh session so it reloads the list. Then use the exact name the server returned.
A stale catalog is the usual cause. An agent that cached its tool list before a connection finished will keep calling a name that no longer exists.
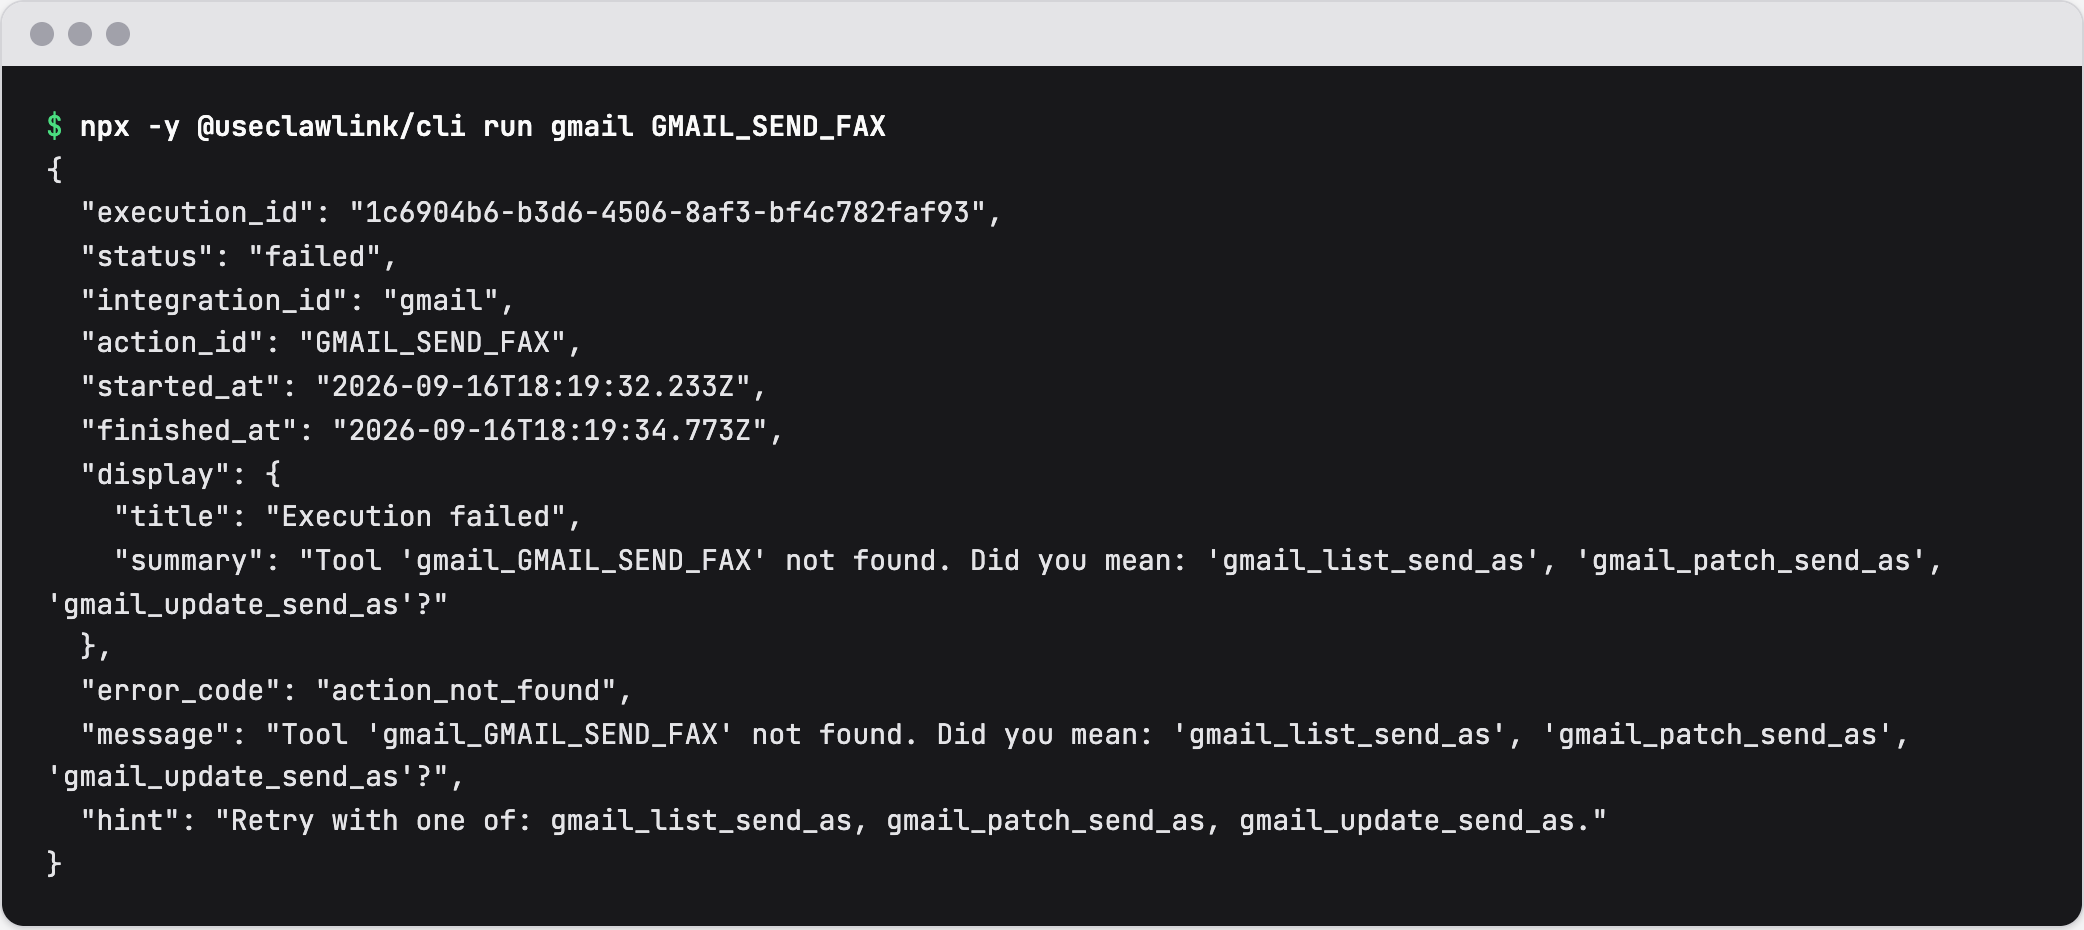 A real tool-not-found failure on 16 September 2026. The hint names the closest tools, so the agent can retry with a real one.
Is the account connected and still authenticated?
OAuth access can be revoked, a provider can force a new login after a password change, or the agent can select the wrong account when several are connected. needs_connection (827) means no connection is attached to the call. needs_reauth (1,359) means one is attached and no longer valid.
The repair is the same: reconnect the app, then retry a read-only call before repeating a write. Retrying a write can duplicate an action that already succeeded.
Does the account have permission?
A tool can exist while the connected account lacks a required scope, workspace role, plan feature, or ownership of the target resource. missing_scopes covers the scope case, and not_found often covers the ownership case, because a provider returns "not found" for a resource the account cannot see.
Test the same action in the provider's own interface with the same account. If it fails there, no MCP client can grant that access.
Why does an MCP call time out?
Long tool runs and large responses are the two common causes. A timeout means the client stopped waiting before the tool finished. Each client sets its own limit, so a tool that needs longer than that limit fails at the client even when the server is healthy.
response_too_large (1,774 calls) is the ClawLink version of this class. The fix is to narrow the request before retrying: filter the query, lower the result limit, or page through the data. Retrying the same oversized call will fail the same way.
Did the provider limit or reject the call?
Rate limits, missing resources, and provider outages happen after a valid call reaches the upstream app. rate_limit (2,472) and provider_unavailable (540) are the two classes here. Respect the provider retry window, and before retrying a write, decide whether the first request may already have succeeded.
What order should I debug an MCP failure in?
- Confirm the server is connected and the tool appears in the catalog.
- Compare the tool name and arguments with the tool schema.
- Confirm the right account is connected and still authenticated.
- Confirm provider permissions, resource ownership, and plan access.
- Read the error code and the provider message before retrying.
- For a write, check whether the first call already succeeded.
For server development, the official MCP debugging guide recommends the MCP Inspector, server logs, client logs, and inspection of the initialization exchange.
What changed in this review
This page was rebuilt on 16 September 2026. It adds the MCP error-code table, fresh production failure counts for the 90 days to 16 September 2026, sections on timeouts and response size, and an FAQ. The August version listed older counts and did not cover error codes.
FAQ
What is the most common reason an MCP tool call fails?
Invalid arguments. In ClawLink's production logs, invalid_arguments was the top actionable class with 11,687 calls in the 90 days to 16 September 2026. Most are a missing required field, a wrong type, or a placeholder value used as a real identifier.
What does MCP error -32001 mean?
The MCP specification does not define -32001, but the TypeScript SDK 1.x does: its ErrorCode enum names -32001 RequestTimeout. Clients built on that SDK report timeouts with it (ErrorCode enum in @modelcontextprotocol/sdk 1.29.0, checked 16 September 2026). A timeout usually means the tool ran longer than the client's limit, not that the tool is broken.
Is a failed MCP tool call always the server's fault?
No. The failure splits across four layers: transport, protocol, tool, and provider. A client that cannot reach the server fails at transport. A missing tool name fails at the protocol layer. A stale credential fails at the tool layer. A provider rate limit fails at the provider layer. Only the last two involve the app you are trying to reach.
Should I just retry a failed tool call?
Retry a read freely. Retry a write only after checking whether the first call already succeeded, because a duplicate send email or create issue is worse than the original error. For rate limits, wait for the provider's window instead of retrying immediately.
How do I know if the problem is permissions or authentication?
Authentication failures say the credential is invalid or expired, and reconnecting fixes them. Permission failures happen with a valid credential that lacks a scope, role, or plan feature. If reconnecting does not fix the call and the same action also fails in the provider's own interface, it is a permission problem.
Where can I see the exact error for a ClawLink tool call?
The dashboard execution log records each call with its error class and message. The aggregate picture, including per-app success rates and the error classes users can act on, is in the tool execution report.