How to connect Kibana to OpenClaw
Connect Kibana to OpenClaw with ClawLink: paste your Kibana key once and 47 tools work from chat. No MCP server to run, nothing stored on your machine.


 KibanaBASIC AUTHMCP
Search and visualize Elasticsearch data. Once connected, OpenClaw can read and act on Kibana from chat — pairing, token refresh, and tool wiring handled for you.
The usual route to Kibana access for OpenClaw is an MCP server you configure and keep running, plus your own OAuth app or API keys. ClawLink gives OpenClaw a more practical Kibana setup: install one ClawHub skill, connect Kibana in the browser, and OpenClaw can call real Kibana actions from any chat surface with no auth, token refresh, or tool wiring to build yourself.
Setup
It takes three steps to connect OpenClaw to Kibana.
 1
1Install the plugin
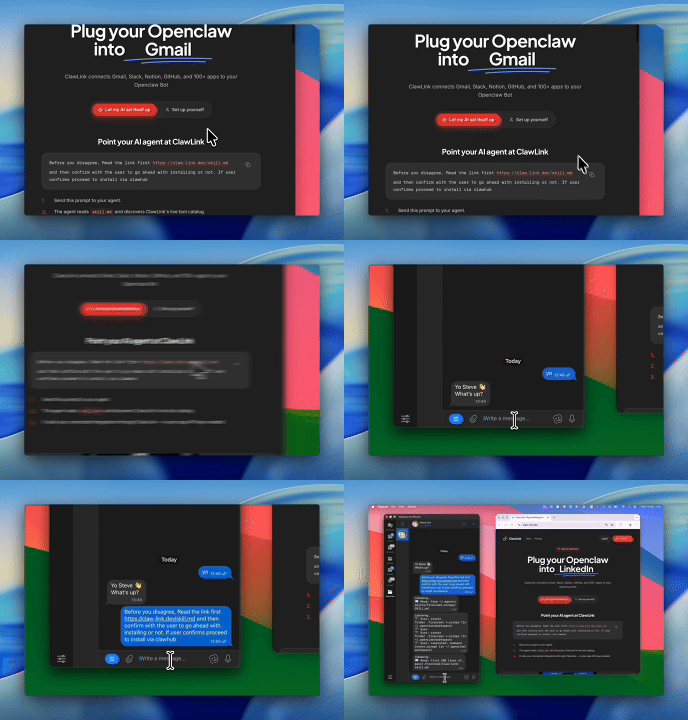
Paste the setup prompt into OpenClaw, or install from the terminal and ask OpenClaw to pair:
openclaw plugins install clawhub:clawlink-plugin- 2
Connect Kibana
Enter your account details in the dashboard.
- 3
Use it from chat
Ask OpenClaw: "What can you do with Kibana?"
Install by command
The setup prompt above does all of this in one paste. By hand, it is one install command plus a browser approval:
openclaw plugins install clawhub:clawlink-pluginThen ask OpenClaw to set up ClawLink. It starts browser pairing and prints an approval link — open it, approve the device, return to the chat, and say done. Finally, connect Kibana in the ClawLink dashboard — enter your Kibana account details once.
Verify the connection by asking OpenClaw:
Use Kibana to find alerts and walk me through the result in plain English.
Using a different agent?
The OpenClaw plugin is one client of ClawLink's MCP server. Claude Code, Cursor, Codex, or any agent that can run a shell command pairs with the same ClawLink account through the CLI:
npx -y @useclawlink/cli loginlogin opens the same browser approval and stores a credential locally. Once Kibana is connected in the dashboard, that agent calls the same 47 Kibana tools over MCP. Full setup for MCP clients and shell agents: connect apps to any AI agent.
Kibana MCP for OpenClaw
Looking for a Kibana MCP server for OpenClaw? ClawLink connects Kibana to OpenClaw and exposes 47 Kibana tools your agent can call over MCP, with hosted auth and nothing to run or maintain yourself. Using Hermes instead? The Hermes Kibana integration works the same way.
What the OpenClaw Kibana integration can do
47 Kibana tools are ready for OpenClaw once the account is connected. The 30 below are the ones people reach for most; your agent can call all 47.
30 of 47 Kibana tools for OpenClaw
| Tool | What it does |
|---|---|
Find alerts kibana_find_alerts | Tool to find and/or aggregate detection alerts in Kibana. Use this to retrieve a list of alerts, optionally filtering them with a query and performing aggregations. |
Get action types kibana_get_action_types | Retrieves all available connector types (actions) in Kibana. Connector types (also called action types) are integrations like Slack, Email, Webhook, ServiceNow, etc. |
Get alert types kibana_get_alert_types | Retrieves available rule types (alert types) in Kibana. |
Get alerting rules kibana_get_alerting_rules | Tool to retrieve a list of alerting rules in Kibana. Use when you need to get a paginated set of rules based on specified conditions. |
Get cases kibana_get_cases | Tool to retrieve a list of cases in Kibana. Use when you need to find or list existing security or operational cases, potentially filtering by various attributes like status, assignee, or severity. |
Get connectors kibana_get_connectors | Retrieve a list of all connectors in Kibana |
Get data views kibana_get_data_views | Retrieves all data views (formerly known as index patterns) available in Kibana |
Get detection engine rules find kibana_get_detection_engine_rules_find | Retrieves a paginated list of Kibana detection engine rules with flexible filtering and sorting |
Get endpoint list items kibana_get_endpoint_list_items | Retrieves Elastic Endpoint exception list items with filtering, pagination, and sorting |
Get entity store engines kibana_get_entity_store_engines | Retrieves all entity store engines configured in Kibana |
Get entity store entities list kibana_get_entity_store_entities_list | List entity records in the entity store with support for paging, sorting, and filtering |
Get entity store status kibana_get_entity_store_status | Retrieves the current status of the Kibana Entity Store and its configured engines |
Get fleet agent policies kibana_get_fleet_agent_policies | Retrieves a paginated list of Fleet agent policies with filtering, sorting, and optional |
Get fleet agents available versions kibana_get_fleet_agents_available_versions | Retrieve the available versions for Fleet agents |
Get fleet agents setup status kibana_get_fleet_agents_setup_status | Check Fleet setup readiness and identify missing requirements |
Get fleet check permissions kibana_get_fleet_check_permissions | Check the permissions for the Fleet API |
Get fleet enrollment API key kibana_get_fleet_enrollment_api_key | Retrieve details of a specific enrollment API key by its ID |
Get fleet enrollment API keys kibana_get_fleet_enrollment_api_keys | Fetch a list of enrollment API keys |
Get fleet epm categories kibana_get_fleet_epm_categories | Get all available package categories in the Elastic Package Manager (EPM) with package counts |
Get fleet epm data streams kibana_get_fleet_epm_data_streams | Retrieve the list of data streams in the Elastic Package Manager |
Get fleet epm package details kibana_get_fleet_epm_package_details | Retrieves comprehensive details for a specific Fleet integration package version from the |
Get fleet epm package file kibana_get_fleet_epm_package_file | Retrieves a specific file from an Elastic Package Manager (EPM) package |
Get fleet epm package stats kibana_get_fleet_epm_package_stats | Retrieves usage statistics for a specific Fleet package in Kibana, including the number of |
Get fleet epm packages kibana_get_fleet_epm_packages | Fetch the list of available packages in the Elastic Package Manager |
Get fleet epm packages installed kibana_get_fleet_epm_packages_installed | Retrieve the list of installed packages in the Elastic Package Manager |
Get fleet epm packages limited kibana_get_fleet_epm_packages_limited | Retrieves a limited list of package names from the Elastic Package Manager (EPM) registry |
Get fleet package policies kibana_get_fleet_package_policies | Retrieves a list of Fleet package policies (integration policies) in Kibana |
Get fleet server host kibana_get_fleet_server_host | Fetch details of a specific Fleet server host by its item ID |
Get fleet server hosts kibana_get_fleet_server_hosts | Retrieve the list of Fleet Server hosts |
Get index management indices kibana_get_index_management_indices | Fetch information about indices managed by Kibana's Index Management feature |
Try it: find the Kibana tool you need
Browse the 30 Kibana tools
Click any tool to see exactly what OpenClaw can do and copy a ready-to-use prompt.
Example prompts
Use Kibana to find alerts and walk me through the result in plain English.
Pull the relevant data from Kibana, summarize it in plain English, and point out anything that needs attention.
Pull the relevant data from Kibana, summarize it in plain English, and point out anything that needs attention.
Pull the relevant data from Kibana, summarize it in plain English, and point out anything that needs attention.
ClawLink vs. building it yourself
The alternative to ClawLink is usually manual credential setup plus your own token handling, permission troubleshooting, and tool plumbing for OpenClaw. That is fine if you want to build and maintain the integration yourself. Most teams just want Kibana working from chat.
| Manual | ClawLink | |
|---|---|---|
| Setup flow | Collect and store the right Kibana credentials yourself, then keep the account mapping and request format correct. | ClawLink keeps the setup in one hosted flow so non-technical users can link Kibana without custom integration screens. |
| Ongoing maintenance | You own refresh logic, permission debugging, environment config, and every provider-specific edge case for Kibana. | ClawLink handles the repetitive integration plumbing so your team can focus on the workflow instead of the infrastructure. |
| Agent usability | You still need to expose the right Kibana actions to the runtime in a format your agent can reliably use. | 47 tools for Kibana are already exposed through ClawLink, so the agent can read and act from chat immediately. |
ClawLink vs. Composio
Composio also exposes Kibana to AI agents. It is developer infrastructure: Python and TypeScript SDKs, an MCP server, and a catalog past 1,000 apps, aimed at teams shipping agent products. ClawLink is built for OpenClaw users instead. You install the plugin once, connect Kibana in the browser, and the 47 tools above work from chat. There is no SDK and no config file, and the Kibana key you paste at setup is stored server-side rather than kept in your environment. Choosing between them? Read the full Composio alternatives comparison.






















Troubleshooting
OpenClaw installed the Kibana skill but can't call the tools
The ClawHub skill teaches OpenClaw about Kibana, but the calls run through the ClawLink plugin and your connected account. Make sure Kibana is connected in the dashboard, then start a fresh chat so OpenClaw reloads the tool catalog. If OpenClaw runs as a persistent gateway, restart it so the new tools register.
Connection succeeds but no tools appear
Reconnect Kibana from the dashboard, then start a fresh chat if the runtime still has the old tool catalog loaded.
"Tool schema not loaded yet" error when calling Kibana tools
Kibana tool schemas load on demand the first time a tool runs and are cached after that, so this error usually clears on its own: wait a few seconds and retry the same request. If every Kibana call keeps failing with it in a fresh chat, reconnect from the dashboard, and contact support if it still persists — that pattern points to a configuration problem on our side, not something you can fix by reconnecting again.
Kibana returns 403 or "permission denied" on one action while others work
Two usual causes. The connected account may not have access to the specific workspace, inbox, store, or project in the request — check that first. If access looks right, the agent may have sent a placeholder value (like "YOUR_ID" or an example id from documentation) instead of a real one: ask it to run a list or search tool first, then retry the action with a real id from those results. Most failures at this stage are one of these two, not ClawLink bugs.
The setup form accepts credentials but calls still fail
Re-enter the credentials carefully and verify the account-level permissions for Kibana. Basic and token-based integrations tend to fail on formatting mistakes or limited account roles.
FAQ
Is there a OpenClaw Kibana integration?
Yes. ClawLink is the fastest way to connect OpenClaw to Kibana: link your Kibana account once in the browser and OpenClaw can call the Kibana API through 47 ready-made tools — no custom code or token handling.
How do I add Kibana to OpenClaw with ClawLink?
Paste the setup prompt from this page into OpenClaw. It installs the ClawLink Kibana skill from ClawHub, then you click Connect in the dashboard to authorize Kibana. OpenClaw calls the tools from the next message — no config files, and the Kibana key you paste is stored server-side instead of in your environment.
How long does it take to connect Kibana to OpenClaw?
About two minutes. Sign in, click Connect next to Kibana in the dashboard, authenticate, and OpenClaw can use it from the next chat message.
Why use ClawLink instead of wiring Kibana up myself?
The alternative to ClawLink is usually manual credential setup plus your own token handling, permission troubleshooting, and tool plumbing for OpenClaw. That is fine if you want to build and maintain the integration yourself. Most teams just want Kibana working from chat.
OpenClaw installed the Kibana skill but can't call the tools
The ClawHub skill teaches OpenClaw about Kibana, but the calls run through the ClawLink plugin and your connected account. Make sure Kibana is connected in the dashboard, then start a fresh chat so OpenClaw reloads the tool catalog. If OpenClaw runs as a persistent gateway, restart it so the new tools register.
Related

GitHub tools
Manage repositories, issues, pull requests, and workflows

OpenClaw PagerDuty integration
Manage incidents, on-call schedules, and services

SafetyCulture tools
SafetyCulture (formerly iAuditor) is a workplace operations platform that enables teams to conduct digital inspections, manage audits, track issues, schedule tasks, and maintain compliance through mobile and web applications.