How to connect Kibana to Hermes Agent
Connect Kibana to Hermes with ClawLink: paste your Kibana key once and 47 tools work from chat. No MCP server to run, nothing stored on your machine.


 KibanaBASIC AUTHMCP
Search and visualize Elasticsearch data. Once connected, Hermes Agent can read and act on Kibana from chat — pairing, token refresh, and tool wiring handled for you.
Most guides for giving Hermes Agent Kibana access start with registering your own OAuth app or pasting API keys into env files, then leave the token refresh and tool wiring to you. ClawLink gives Hermes a more practical Kibana setup: pair once in the browser and your always-on Hermes agent can act on Kibana for you, reading and doing real work on your behalf with no auth, token refresh, or tool wiring to build yourself.
Setup
It takes three steps to connect Hermes to Kibana.
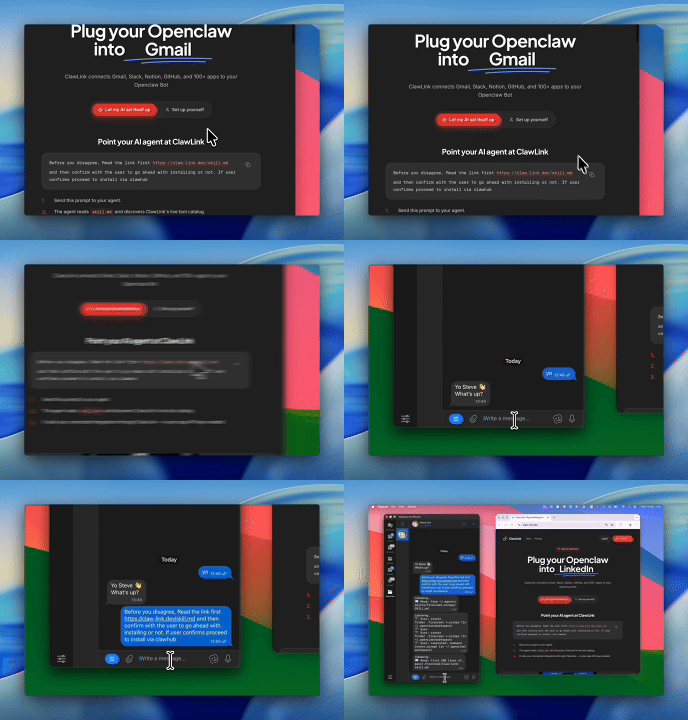 1
1Install and pair
Install the ClawLink plugin, then pair Hermes with a one-time browser approval:
hermes plugins install ClawLink-HQ/hermes-plugin --enable- 2
Connect Kibana
Enter your account details in the dashboard.
- 3
Use it from chat
Ask Hermes Agent: "What can you do with Kibana?"
Install by command
The prompt above walks Hermes through this. By hand, it is four commands and a browser approval:
hermes plugins install ClawLink-HQ/hermes-plugin --enable
hermes clawlink begin    # prints an approval link — open it and approve
hermes clawlink finish   # after approving in the browser
hermes clawlink test
Then connect Kibana in the ClawLink dashboard — enter your Kibana account details once.
Verify the connection by asking Hermes:
Use kibana_find_alerts for the last 24 hours and group the results by severity and rule. Flag anything critical that has no assigned case.
Using a different agent?
The Hermes plugin is one client of ClawLink's MCP server. Claude Code, Cursor, Codex, or any agent that can run a shell command pairs with the same ClawLink account through the CLI:
npx -y @useclawlink/cli loginlogin opens the same browser approval and stores a credential locally. Once Kibana is connected in the dashboard, that agent calls the same 47 Kibana tools over MCP. Full setup for MCP clients and shell agents: connect apps to any AI agent.
Kibana MCP for Hermes
Looking for a Kibana MCP server for Hermes Agent? ClawLink connects Kibana to Hermes Agent and exposes 47 Kibana tools your agent can call over MCP, with hosted auth and nothing to run or maintain yourself. Using OpenClaw instead? The OpenClaw Kibana integration works the same way.
Kibana is the observability and security console in front of Elasticsearch, and the 47 tools here split along those two lines: detection alerts, alerting rules, and cases on the security side, data views, Fleet agent policies, index management, and the entity store on the operations side. The connection takes credentials pasted once and held server-side, so there is no token file next to your agent and no Authorization header for you to format, which matters because the searches around this provider are mostly people debugging exactly those two things. This page is about Kibana the Elastic product, not the other things the name gets attached to in search, and the pages behind the queries that name ClawLink are the ones that describe this flow.
What the Hermes Agent Kibana integration can do
47 Kibana tools are ready for Hermes Agent once the account is connected. The 30 below are the ones people reach for most; your agent can call all 47.
30 of 47 Kibana tools for Hermes
| Tool | What it does |
|---|---|
Find alerts kibana_find_alerts | Tool to find and/or aggregate detection alerts in Kibana. Use this to retrieve a list of alerts, optionally filtering them with a query and performing aggregations. |
Get action types kibana_get_action_types | Retrieves all available connector types (actions) in Kibana. Connector types (also called action types) are integrations like Slack, Email, Webhook, ServiceNow, etc. |
Get alert types kibana_get_alert_types | Retrieves available rule types (alert types) in Kibana. |
Get alerting rules kibana_get_alerting_rules | Tool to retrieve a list of alerting rules in Kibana. Use when you need to get a paginated set of rules based on specified conditions. |
Get cases kibana_get_cases | Tool to retrieve a list of cases in Kibana. Use when you need to find or list existing security or operational cases, potentially filtering by various attributes like status, assignee, or severity. |
Get connectors kibana_get_connectors | Retrieve a list of all connectors in Kibana |
Get data views kibana_get_data_views | Retrieves all data views (formerly known as index patterns) available in Kibana |
Get detection engine rules find kibana_get_detection_engine_rules_find | Retrieves a paginated list of Kibana detection engine rules with flexible filtering and sorting |
Get endpoint list items kibana_get_endpoint_list_items | Retrieves Elastic Endpoint exception list items with filtering, pagination, and sorting |
Get entity store engines kibana_get_entity_store_engines | Retrieves all entity store engines configured in Kibana |
Get entity store entities list kibana_get_entity_store_entities_list | List entity records in the entity store with support for paging, sorting, and filtering |
Get entity store status kibana_get_entity_store_status | Retrieves the current status of the Kibana Entity Store and its configured engines |
Get fleet agent policies kibana_get_fleet_agent_policies | Retrieves a paginated list of Fleet agent policies with filtering, sorting, and optional |
Get fleet agents available versions kibana_get_fleet_agents_available_versions | Retrieve the available versions for Fleet agents |
Get fleet agents setup status kibana_get_fleet_agents_setup_status | Check Fleet setup readiness and identify missing requirements |
Get fleet check permissions kibana_get_fleet_check_permissions | Check the permissions for the Fleet API |
Get fleet enrollment API key kibana_get_fleet_enrollment_api_key | Retrieve details of a specific enrollment API key by its ID |
Get fleet enrollment API keys kibana_get_fleet_enrollment_api_keys | Fetch a list of enrollment API keys |
Get fleet epm categories kibana_get_fleet_epm_categories | Get all available package categories in the Elastic Package Manager (EPM) with package counts |
Get fleet epm data streams kibana_get_fleet_epm_data_streams | Retrieve the list of data streams in the Elastic Package Manager |
Get fleet epm package details kibana_get_fleet_epm_package_details | Retrieves comprehensive details for a specific Fleet integration package version from the |
Get fleet epm package file kibana_get_fleet_epm_package_file | Retrieves a specific file from an Elastic Package Manager (EPM) package |
Get fleet epm package stats kibana_get_fleet_epm_package_stats | Retrieves usage statistics for a specific Fleet package in Kibana, including the number of |
Get fleet epm packages kibana_get_fleet_epm_packages | Fetch the list of available packages in the Elastic Package Manager |
Get fleet epm packages installed kibana_get_fleet_epm_packages_installed | Retrieve the list of installed packages in the Elastic Package Manager |
Get fleet epm packages limited kibana_get_fleet_epm_packages_limited | Retrieves a limited list of package names from the Elastic Package Manager (EPM) registry |
Get fleet package policies kibana_get_fleet_package_policies | Retrieves a list of Fleet package policies (integration policies) in Kibana |
Get fleet server host kibana_get_fleet_server_host | Fetch details of a specific Fleet server host by its item ID |
Get fleet server hosts kibana_get_fleet_server_hosts | Retrieve the list of Fleet Server hosts |
Get index management indices kibana_get_index_management_indices | Fetch information about indices managed by Kibana's Index Management feature |
Try it: find the Kibana tool you need
Browse the 30 Kibana tools
Click any tool to see exactly what Hermes can do and copy a ready-to-use prompt.
Example prompts
Use kibana_find_alerts for the last 24 hours and group the results by severity and rule. Flag anything critical that has no assigned case.
Pull the alerting rules with kibana_get_alerting_rules and tell me which rules are active, which are muted or disabled, and which have no last run status.
List the security cases with kibana_get_cases and tell me which are open, how old the oldest is, and which ones mention the same indicator as the alert I just shared.
List the data views with kibana_get_data_views and tell me which indices they cover and which ones look stale or unassigned.
How the Kibana tools behave
Details that decide whether a Kibana prompt is a fast answer or a permissions wall.
- Two surfaces, two tool families. The security tools (alerts, detection rules, cases) need Security feature privileges; the operations tools (data views, Fleet, EPM, index management) need their own roles. A 403 on one family while the other works is a role problem, not a connection problem.
- Rules are not alerts.
kibana_get_detection_engine_rules_findlists detection rules,kibana_get_alerting_rulescovers alerting rules, andkibana_find_alertsreads the alerts they produce. A prompt mixing them returns confusingly empty results. - Data views, not index patterns. The old name still appears in search results; the tool is
kibana_get_data_viewsand it is the map of what indices exist to the agent. - Fleet and EPM are their own cluster. Agent policies, server hosts, enrollment keys, packages, data streams, and package policies: agent fleet management is the largest single tool family in this set.
- Ids and spaces matter. Alerts, rules, cases, and views are addressed by id and live in spaces; an id from documentation or from another space fails like a permission error.
- The entity store is the operations overview.
kibana_get_entity_store_engines,kibana_get_entity_store_status, andkibana_get_entity_store_entities_listanswer "what does the deployment know about its entities" in three calls.
ClawLink vs. building it yourself
The alternative to ClawLink is usually manual credential setup plus your own token handling, permission troubleshooting, and tool plumbing for Hermes Agent. That is fine if you want to build and maintain the integration yourself. Most teams just want Kibana working from chat.
| Manual | ClawLink | |
|---|---|---|
| Setup flow | Collect and store the right Kibana credentials yourself, then keep the account mapping and request format correct. | ClawLink keeps the setup in one hosted flow so non-technical users can link Kibana without custom integration screens. |
| Ongoing maintenance | You own refresh logic, permission debugging, environment config, and every provider-specific edge case for Kibana. | ClawLink handles the repetitive integration plumbing so your team can focus on the workflow instead of the infrastructure. |
| Agent usability | You still need to expose the right Kibana actions to the runtime in a format your agent can reliably use. | 47 tools for Kibana are already exposed through ClawLink, so the agent can read and act from chat immediately. |
ClawLink vs. Composio
Composio also exposes Kibana to AI agents. It is developer infrastructure: Python and TypeScript SDKs, an MCP server, and a catalog past 1,000 apps, aimed at teams shipping agent products. ClawLink is built for Hermes Agent users instead. You install the plugin once, connect Kibana in the browser, and the 47 tools above work from chat. There is no SDK and no config file, and the Kibana key you paste at setup is stored server-side rather than kept in your environment. Choosing between them? Read the full Composio alternatives comparison.

























Troubleshooting
Hermes paired but still can't use Kibana
Pairing is a two-step handshake: run hermes clawlink begin, approve the link in your browser, then run hermes clawlink finish. If you ran finish before approving, or the approval link expired, run hermes clawlink begin again to get a fresh link. Confirm the plugin was installed with --enable, then verify with hermes clawlink test.
Connection succeeds but no tools appear
Reconnect Kibana from the dashboard, then start a fresh chat if the runtime still has the old tool catalog loaded.
"Tool schema not loaded yet" error when calling Kibana tools
Kibana tool schemas load on demand the first time a tool runs and are cached after that, so this error usually clears on its own: wait a few seconds and retry the same request. If every Kibana call keeps failing with it in a fresh chat, reconnect from the dashboard, and contact support if it still persists — that pattern points to a configuration problem on our side, not something you can fix by reconnecting again.
Kibana returns 403 or "permission denied" on one action while others work
Two usual causes. The connected account may not have access to the specific workspace, inbox, store, or project in the request — check that first. If access looks right, the agent may have sent a placeholder value (like "YOUR_ID" or an example id from documentation) instead of a real one: ask it to run a list or search tool first, then retry the action with a real id from those results. Most failures at this stage are one of these two, not ClawLink bugs.
Kibana returns 401 invalid token while the account shows as connected
The engines teach this as Elastic-native token mechanics: an expired, malformed, or missing token, a header formatting problem, an API key revoked in the dashboard. ChatGPT's p3 phrasing is the useful one: "the stored token is expired, revoked, malformed, or not sent in the expected Authorization: Bearer header, even though the account connection still exists". On a hosted connection there is no header and no local token file, so the fix is the hosted one: the credential lives on our side, and when it goes stale every Kibana call 401s while the dashboard still shows a connection. Disconnect and reconnect from the ClawLink dashboard to issue a fresh credential. If only some calls 401, the credential is fine and you are looking at permission or space scope instead, see the 403 card.
Ask the agent to diagnose it:
Call kibana_get_data_views, the cheapest read in the set, and quote exactly what it returns including the status code. Do not retry the failing tools until we have that result.Kibana returns 403 or insufficient permissions on some calls while others work
Kibana permissions are layered and the engine-taught causes are the right map: the connected user or API key must hold the required security roles, feature privileges, and space access for each endpoint, and a user with dashboard-read access but not the Security feature privileges gets 403 on the alert tools while the data-view tools succeed. The connection is bound to the account that approved it, so the account's roles are the ceiling. After roles, the hosted-agent causes: a space mismatch, the call targets space A while the connection and the data are in space B, and placeholder ids, an alert or rule id from documentation, which fail as permission errors because the object is not in the connected scope.
Ask the agent to diagnose it:
Call kibana_get_data_views and kibana_get_alerting_rules and tell me which succeeds. Then quote the exact error from the failed call and which space or id it mentioned.A Kibana tool is not found, or no Kibana tools appear
The engine-taught fixes for this error assume a locally configured MCP host: config file paths, restarting an IDE, checking a tool registry. None of that exists here. On this setup a missing tool is almost always the lazy-schema timing case: schemas load on demand, so the first Kibana call in a fresh session can arrive before the catalog and needs one retry. If tools stay missing after that, the pairing is the suspect: confirm the plugin was installed with --enable, both hermes clawlink begin and hermes clawlink finish ran, and Kibana shows as connected in the dashboard.
Ask the agent to diagnose it:
List the Kibana tools you actually have access to. If there are none, say so plainly. If there are, tell me which one reads alerts and use that exact name.The setup form accepts credentials but calls still fail
Re-enter the credentials carefully and verify the account-level permissions for Kibana. Basic and token-based integrations tend to fail on formatting mistakes or limited account roles.
FAQ
Is there a Hermes Agent Kibana integration?
Yes. ClawLink is the fastest way to connect Hermes to Kibana: link your Kibana account once in the browser and Hermes Agent can call the Kibana API through 47 ready-made tools — no custom code or token handling.
How do I connect Kibana to Hermes with ClawLink?
Install the plugin with hermes plugins install ClawLink-HQ/hermes-plugin --enable, then pair once: run hermes clawlink begin, approve the link in your browser, and run hermes clawlink finish. Connect Kibana in the dashboard and Hermes can use it from the next message — no config files, and the Kibana key you paste is stored server-side instead of in your environment.
How long does it take to connect Kibana to Hermes Agent?
About two minutes. Sign in, click Connect next to Kibana in the dashboard, authenticate, and Hermes Agent can use it from the next chat message.
Why use ClawLink instead of wiring Kibana up myself?
The alternative to ClawLink is usually manual credential setup plus your own token handling, permission troubleshooting, and tool plumbing for Hermes Agent. That is fine if you want to build and maintain the integration yourself. Most teams just want Kibana working from chat.
What can the agent actually do in Kibana?
The security surface reads first: kibana_find_alerts searches and aggregates detection alerts, kibana_get_detection_engine_rules_find lists the rules behind them, kibana_get_alerting_rules covers the alerting rules, and kibana_get_cases reads the security cases. The operations surface covers what runs: data views (formerly index patterns), connectors and their types, Fleet agent policies and server hosts, Elastic Package Manager packages and installed packages, index management, and the entity store. There is no dashboard rendering tool in this set, so think of the agent as a reader and triager of alerts and state rather than a Kibana UI replacement.
What are the rate limits on the Kibana APIs?
Elastic's own docs state there are no native rate limits restricting use of the Kibana APIs, and that is the answer the AI Overview gives. The caveat worth knowing: hosted Elastic Cloud deployments apply account-level API rate limits, so 429 responses are still possible on a busy deployment even though Kibana itself has no limit. On this connection, calls run under the connected account's reach, so treat a 429 as the deployment's constraint and shape the work: fewer alert sweeps, narrower time ranges, one rule type at a time.
"Without an API key" on Kibana means what, exactly?
Two different intents collide on this phrase and it is worth keeping them apart. Google hears "Kibana's AI capabilities without LLM API keys" and answers with Elastic Managed LLMs or a local LLM. This page's meaning is narrower: no Elastic credentials for the user to create or manage, because the connection holds them server-side. If your question is about the model behind the agent, that is a separate key and a separate conversation, not this page. If your question is about not owning Elastic API keys, this page is the answer.
Is it safe to connect Kibana to an AI agent?
The engines answer this with strict access controls, data masking, and least privilege, and Elastic has published security advisories affecting its AI assistant surface, so treat Kibana as sensitive infrastructure. The hosted connection helps on the credential axis: there is no static token in an environment file on an agent machine, and disconnecting from the dashboard revokes access immediately. What it does not change is the access itself: the agent can reach what the connected account can reach, so connect with an account scoped to the data the agent actually needs, and keep alerts and cases, which contain detection context, out of prompts you do not need them in.
Hermes paired but still can't use Kibana
Pairing is a two-step handshake: run hermes clawlink begin, approve the link in your browser, then run hermes clawlink finish. If you ran finish before approving, or the approval link expired, run hermes clawlink begin again to get a fresh link. Confirm the plugin was installed with --enable, then verify with hermes clawlink test.
Related

Connect SafetyCulture
SafetyCulture (formerly iAuditor) is a workplace operations platform that enables teams to conduct digital inspections, manage audits, track issues, schedule tasks, and maintain compliance through mobile and web applications.

Hermes LaunchDarkly integration
A feature management platform that helps teams build better software faster using feature flags.

Hermes Crowdin integration
Manage translations, localization projects, and language resources